Analytics
Does C.O.R. Help Reduce Injuries?
Firms registered for the voluntary COR program experienced substantial reduction in their time loss injury rate (TLIR).
Anecdotally, we have observed that firms experiencing what we call “business expansion” seem to experience higher injury rates.

As the debate over infrastructure spending and economic stimulus rages on, our focus has been on looking at the potential impact to injury rates that might result from an influx of cash in the construction sector.
We’ll leave the economic debate to the economists and politicians but we’ll go on record supporting infrastructure spending.
A quick disclaimer: some details around the data used in this analysis are confidential and, as such, certain particulars have been intentionally omitted.
Anecdotally, we have observed that firms experiencing what we call “business expansion” seem to experience higher injury rates.
Logically, this makes sense. When firms grow rapidly they need to bring on new workers and handle change. Often there is pressure to move fast to maximize opportunities to grow. New workers will not be entirely familiar with the risks of their job or the safety practices of their new employers. Combine that with a fast paced environment and you’ve got a recipe for increased risk.
We looked into the data to see if we could find a correlation. Using change in payroll as an indicator of business expansion, we analysed that data alongside time loss injury records.
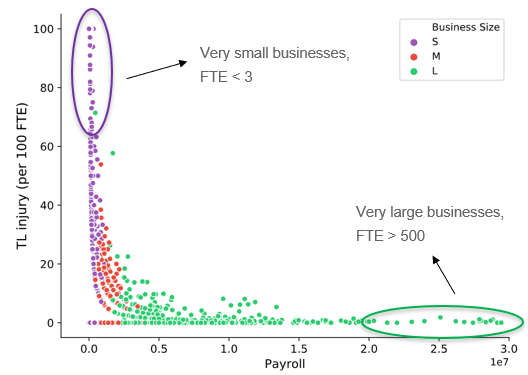
As you can see in Figure 1, firms with larger payrolls tend to have lower injury rates.
Looking at this chart you might conclude that as a business grows their injury rate will decrease. Our analysis indicates otherwise.
We looked at business growth, as represented by increases in payroll, and time loss injury rates of about 2900 construction firms between 2014 – 2019.
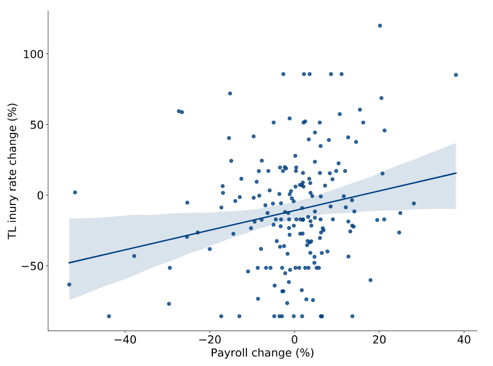
Figure 2 Relationship between changes in payroll and changes in time loss injury rate for medium size firms. Payroll changes and TL injury changes are yearly values, averaged over years of operation (between 2 – 6 years). Each point represents a firm.
As it turns out, when businesses experience expansion they also experience an increase in their injury rate. The greater the rate of expansion, the greater the increase in time loss injury rate.
Regardless of the size of a firm or the sub sector they operate in, there is a direct relationship between business expansion and changes in TL injury rate.
We call this the safety vulnerability business growth index (SVI). SVI is defined as the expected increase in TL injury rate for every 10% growth in payroll. For example, a firm with a SVI of 3, is likely to experience a 3% increase in its LTIR for every 10% growth in its payroll.
Figure 3 shows the SVI for each of small, medium and large firms.
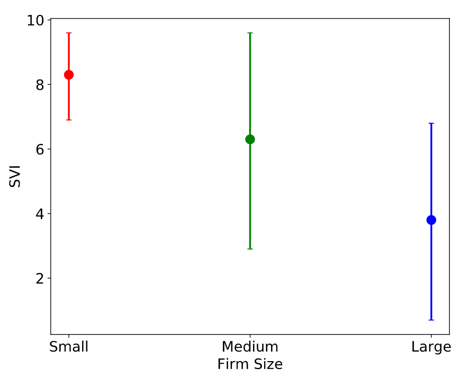
Figure 3 Safety vulnerability index (SVI) of small, medium and large firms. The error line represents 95% confidence interval.
The results of this study are important as they offer firms, safety associations and WCB boards guidance on how to mitigate the human risks associated with large infrastructure stimulus investments.
Firms registered for the voluntary COR program experienced substantial reduction in their time loss injury rate (TLIR).
If you thought of becoming a data scientist, you probably took one of those fancy courses where they taught you how to train deep neural networks.
Firms are motivated by understanding their injury performance measured against the performance of their peers.