Safety Culture
Using Data to Strengthen Safety Culture: Improving Construction Safety
See how construction firms are using data-driven insights to improve workplace safety culture.
Safety Fatigue is a workplace/worker condition where apathy towards policy & procedure is heightened to ineffectiveness & increasing risk/negative value.

I have searched google for “safety fatigue” many times. It has only ever turned up articles on tired workers and how to combat this issue.
I think we, at EHS, may be the only ones who use this term. We use it a lot in our work and discussions with clients. Curiously though, every time we mention this phenomenon to clients, they know exactly what we are talking about.
How does your organization define it? How do you experience it?
We define Safety Fatigue as a workplace and worker condition where apathy towards policy and procedure is heightened to the point of not only ineffectiveness but also increasing risk/negative value.
It shows itself in many ways, but one of the most compelling is the Lost Time Incident Rate seen in Canada and around the ‘safety-mature’ world.
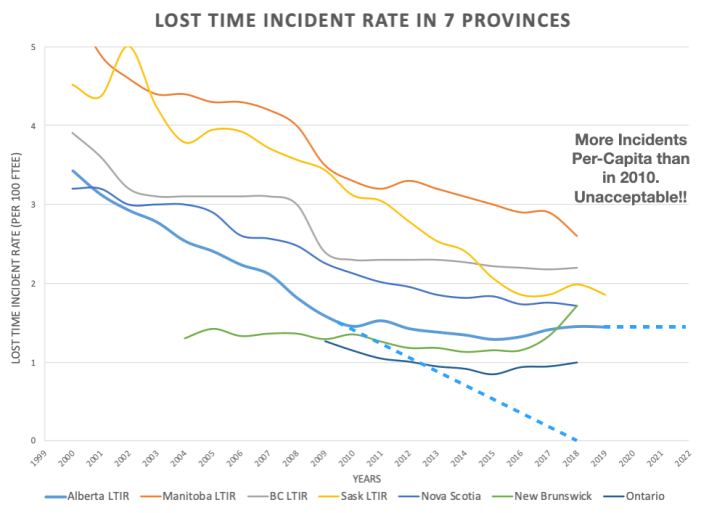
What is happening and why did safety stop improving? Using Alberta as an example, in 2010 it looked like LTIR was headed to 0 (dashed blue line)…..but then it turned. All jurisdictions have turned or are going to turn.
Since 2010, we can all acknowledge that ever-increasing attempts have been made to improve safety, yet where are the results? This isn’t just Safety Fatigue from workers, this is Safety Exhaustion from the system. The pedal is to the metal yet the car isn’t going any faster.
This is the challenge of all governments/legislators, occupational health and safety enforcement arms, industry safety associations, and employers. They keep trying and trying but with little result.
Sophisticated data collection and analysis is taking safety out of the dark ages.
To quote W. Edwards Deming: “It is not enough to do your best; you must know what to do, and then do your best.”
We must figure out how to ‘know what to do’. We must boldly reimagine what safety is and we must transition to being data driven rather than working in the narrative.
When we started EHS Analytics, we saw what was happening in the LTIR in the chart above and we saw how ineffective some strategies were and how we needed to change this. We saw that something could be done to transition from the narrative by harnessing data. Now, our sophisticated data collection and analysis is taking safety out of the dark ages.
One of the main discoveries in our work is that safety’s lack of improvement is because of a lack of data frequency for the end user. There exists, for almost every employer, a sampling problem with respect to the broad spectrum of risk they are exposed to versus their experience.
However, if the experiences of many could be compounded and relayed back to the few, this would solve the problem. This is the fundamental change needed to improve safety.
A stream of useful information, founded in real experience, can provide significant instructive value to employers and all those influencing safety. But, more importantly, this is the foundation for the creation of true leading indicators.
 Let’s go from tired and worn to new and sophisticated.
We envision a day in the near future where, just like your oil warning light on your car or your tire sensors, there are readily available indicators in safety, sourced from across a data spectrum, that are instructive, give early warning and save lives. An analogue would be the system of interconnectedness that would make self driving cars possible. One car can’t do it alone but when all are combined on the road they can look out for each other and better inform and protect everyone.
See how construction firms are using data-driven insights to improve workplace safety culture.
After years of working with safety data, we have seen it all. Failing to get your safety data collection right can cause injuries or fatalities.
A leading indicator in safety is a piece of data that corresponds with and can help to predict and forecast future change in risk and unsafe events.